A log tool is helpful to view bucket logs in a user-readable format and understand the action(s) performed against a bucket. Wasabi administrative logs can be used for audit purposes. They contain details about the request, such as the request type, the resources specified in the request, and the time and date that the request was processed.
Download the log tool using the link below based on your OS flavor:
Mac OS (https://s3.us-east-1.wasabisys.com/wasabi-tools/wasabi-bucket-logs/Wasabi-Bucket_logs_viewer-Mac.zip)
Windows OS (https://s3.us-east-1.wasabisys.com/wasabi-tools/wasabi-bucket-logs/wasabi-bucket-logs-viewer-windows.rar)
Linux OS (https://s3.us-east-1.wasabisys.com/wasabi-tools/wasabi-bucket-logs/wasabi-bucket-logs-viewer-linux-x64.rar)
Double-click and unzip one of the following:
Wasabi-Bucket_logs_viewer-Mac.zip
Wasabi-Bucket_logs_viewer-windows.rar
Wasabi-Bucket_logs_viewer-linux-x64.rar
An example for Mac OS is:
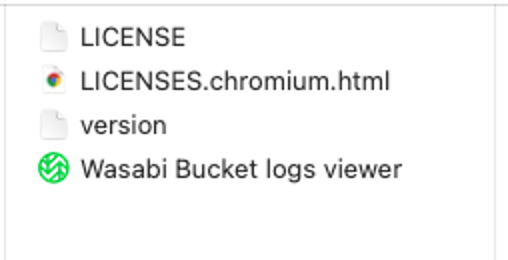
Once unzipped, click Wasabi Bucket logs viewer to open the tool.
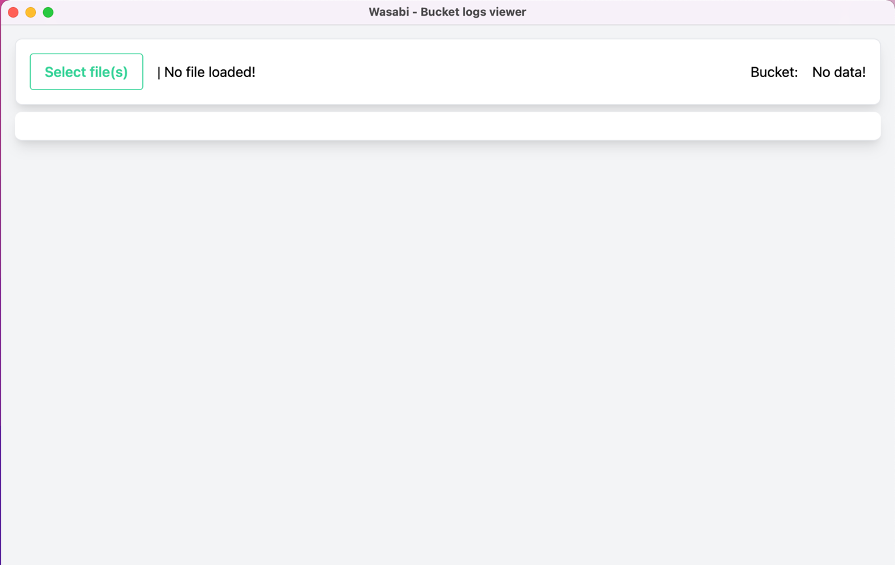
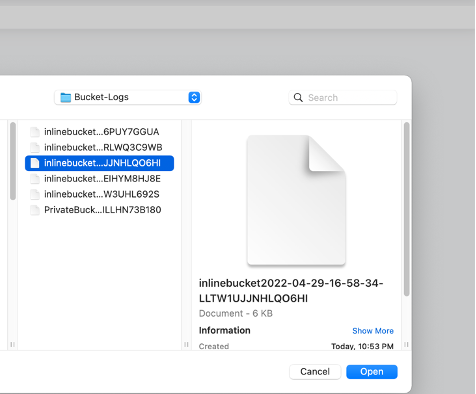
Click Select file(s) and select the bucket log file(s) you want to analyze from your local system or downloaded folder.
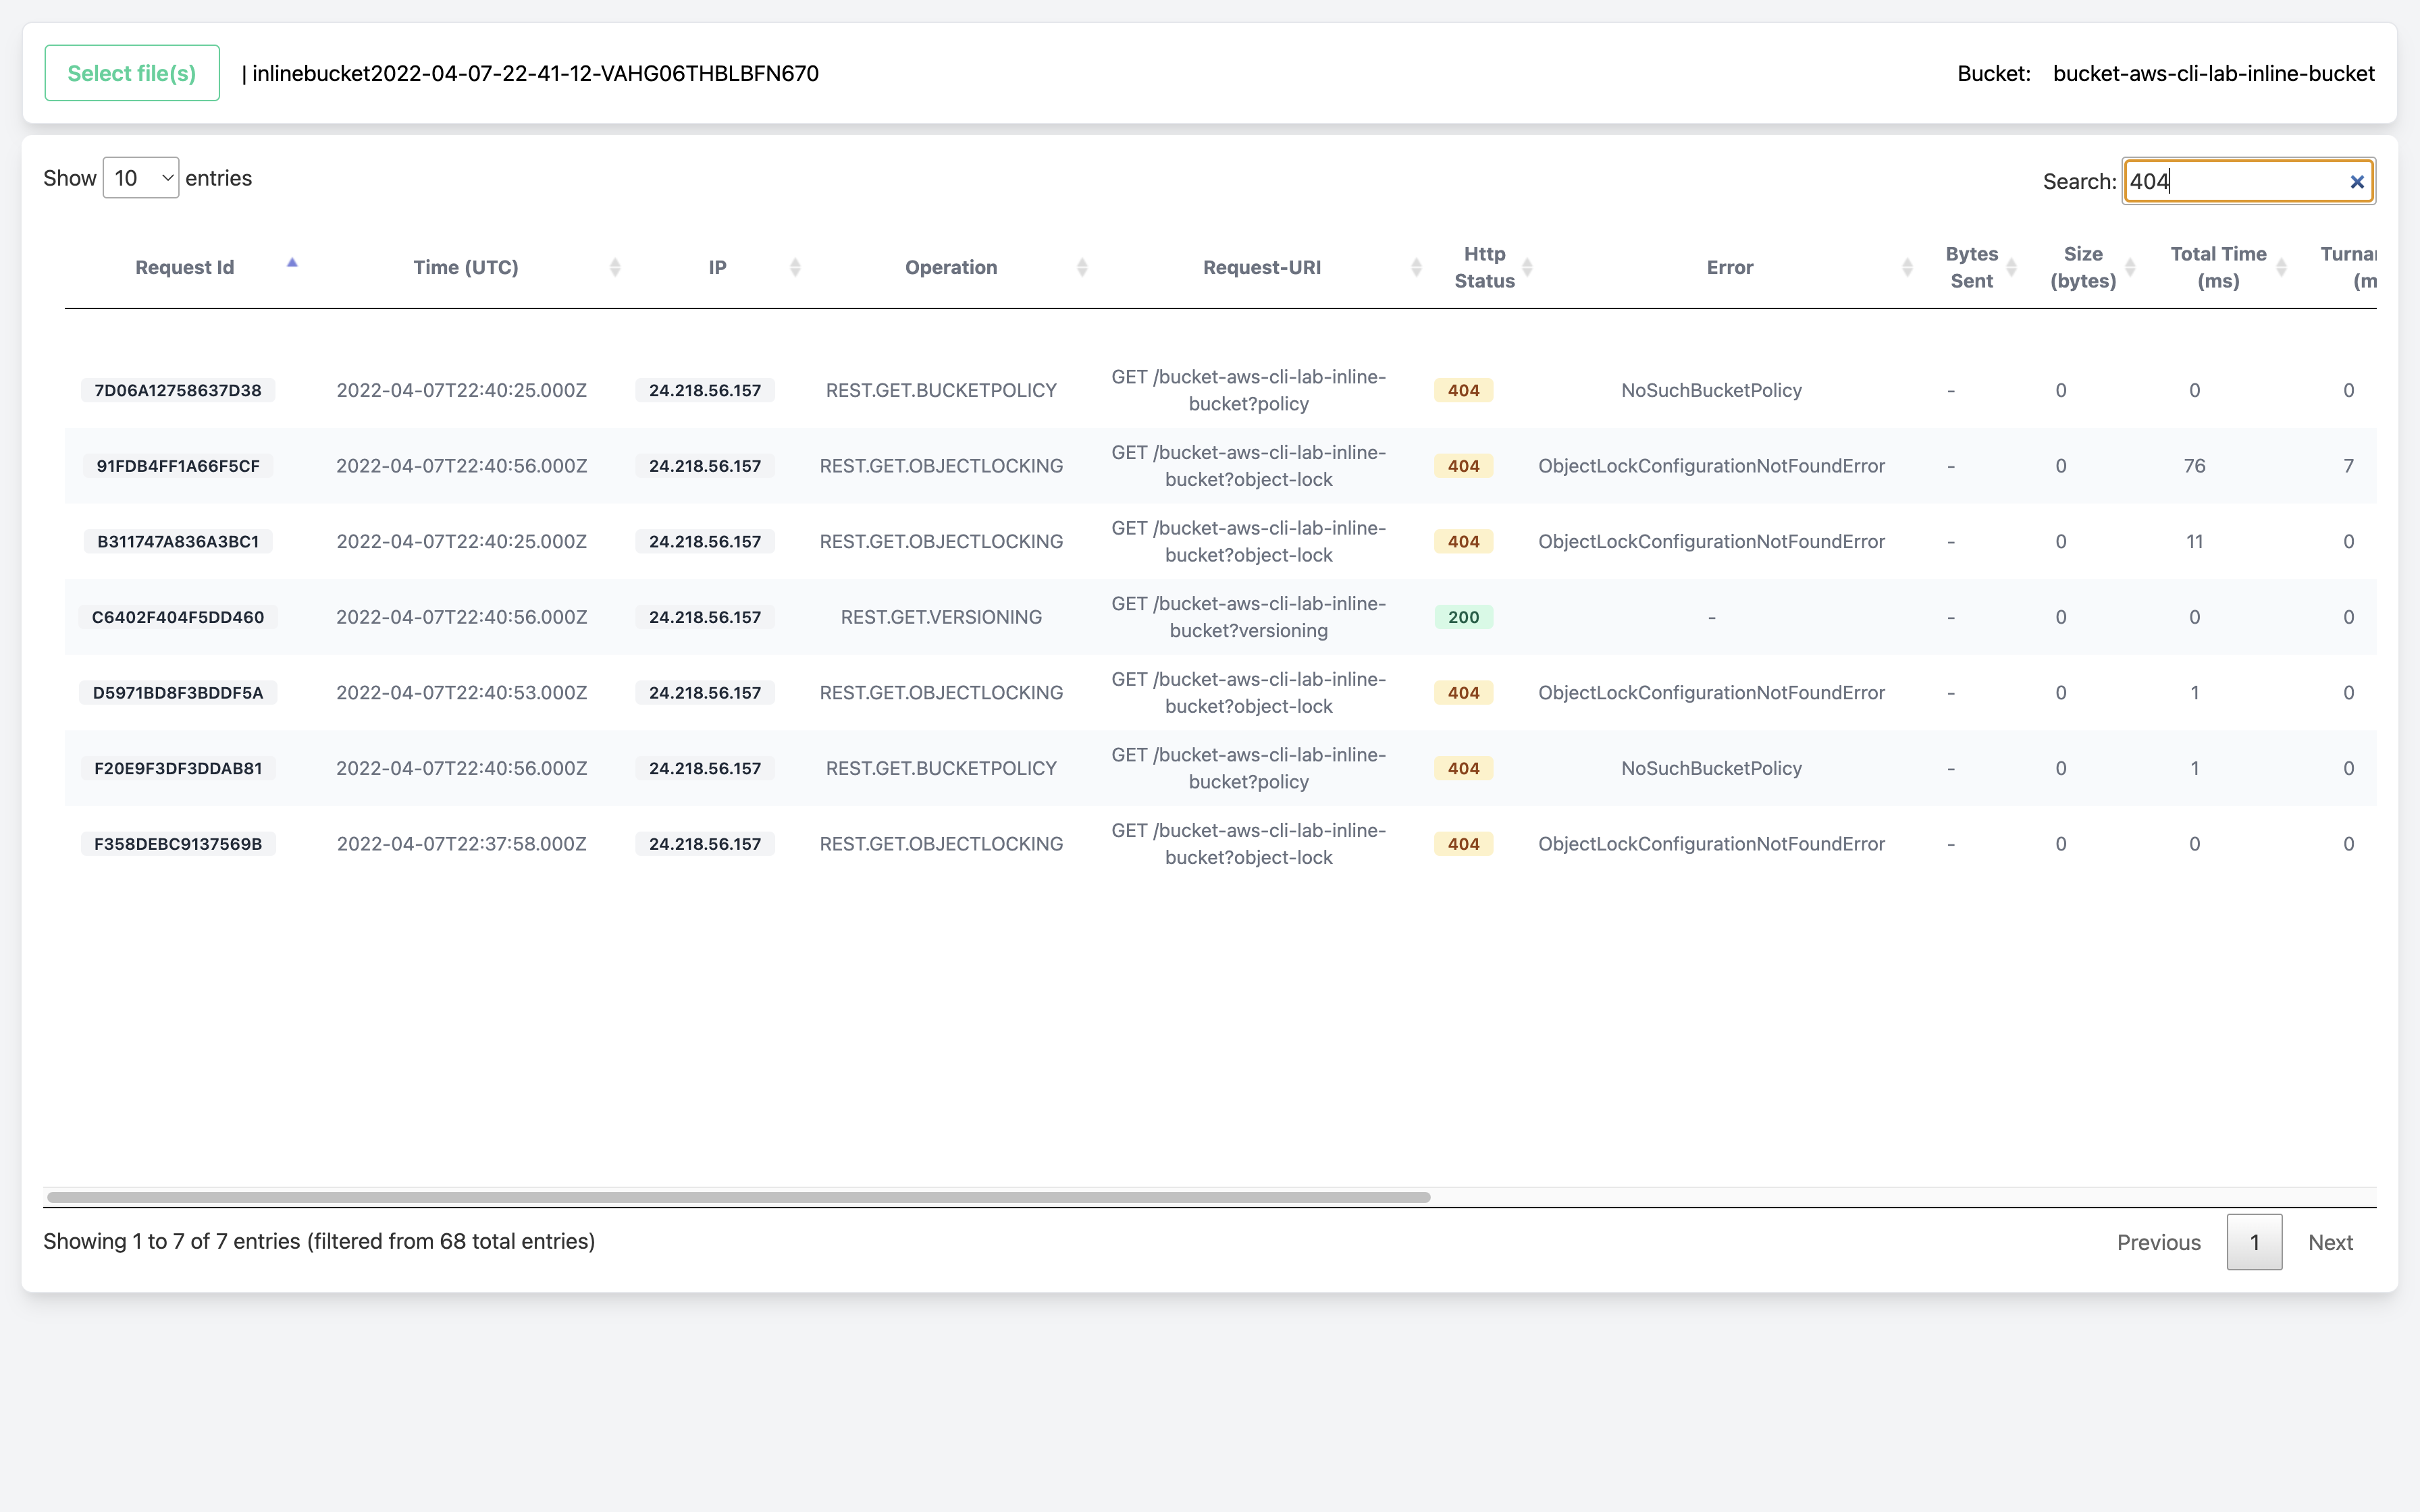
The following example shows output when a log file is opened successfully. The name of the file is displayed next to the Select file(s) feature and the bucket name on the right top. The number of entries to be displayed on a single page can be chosen from a minimum of 10 to a maximum of 100.
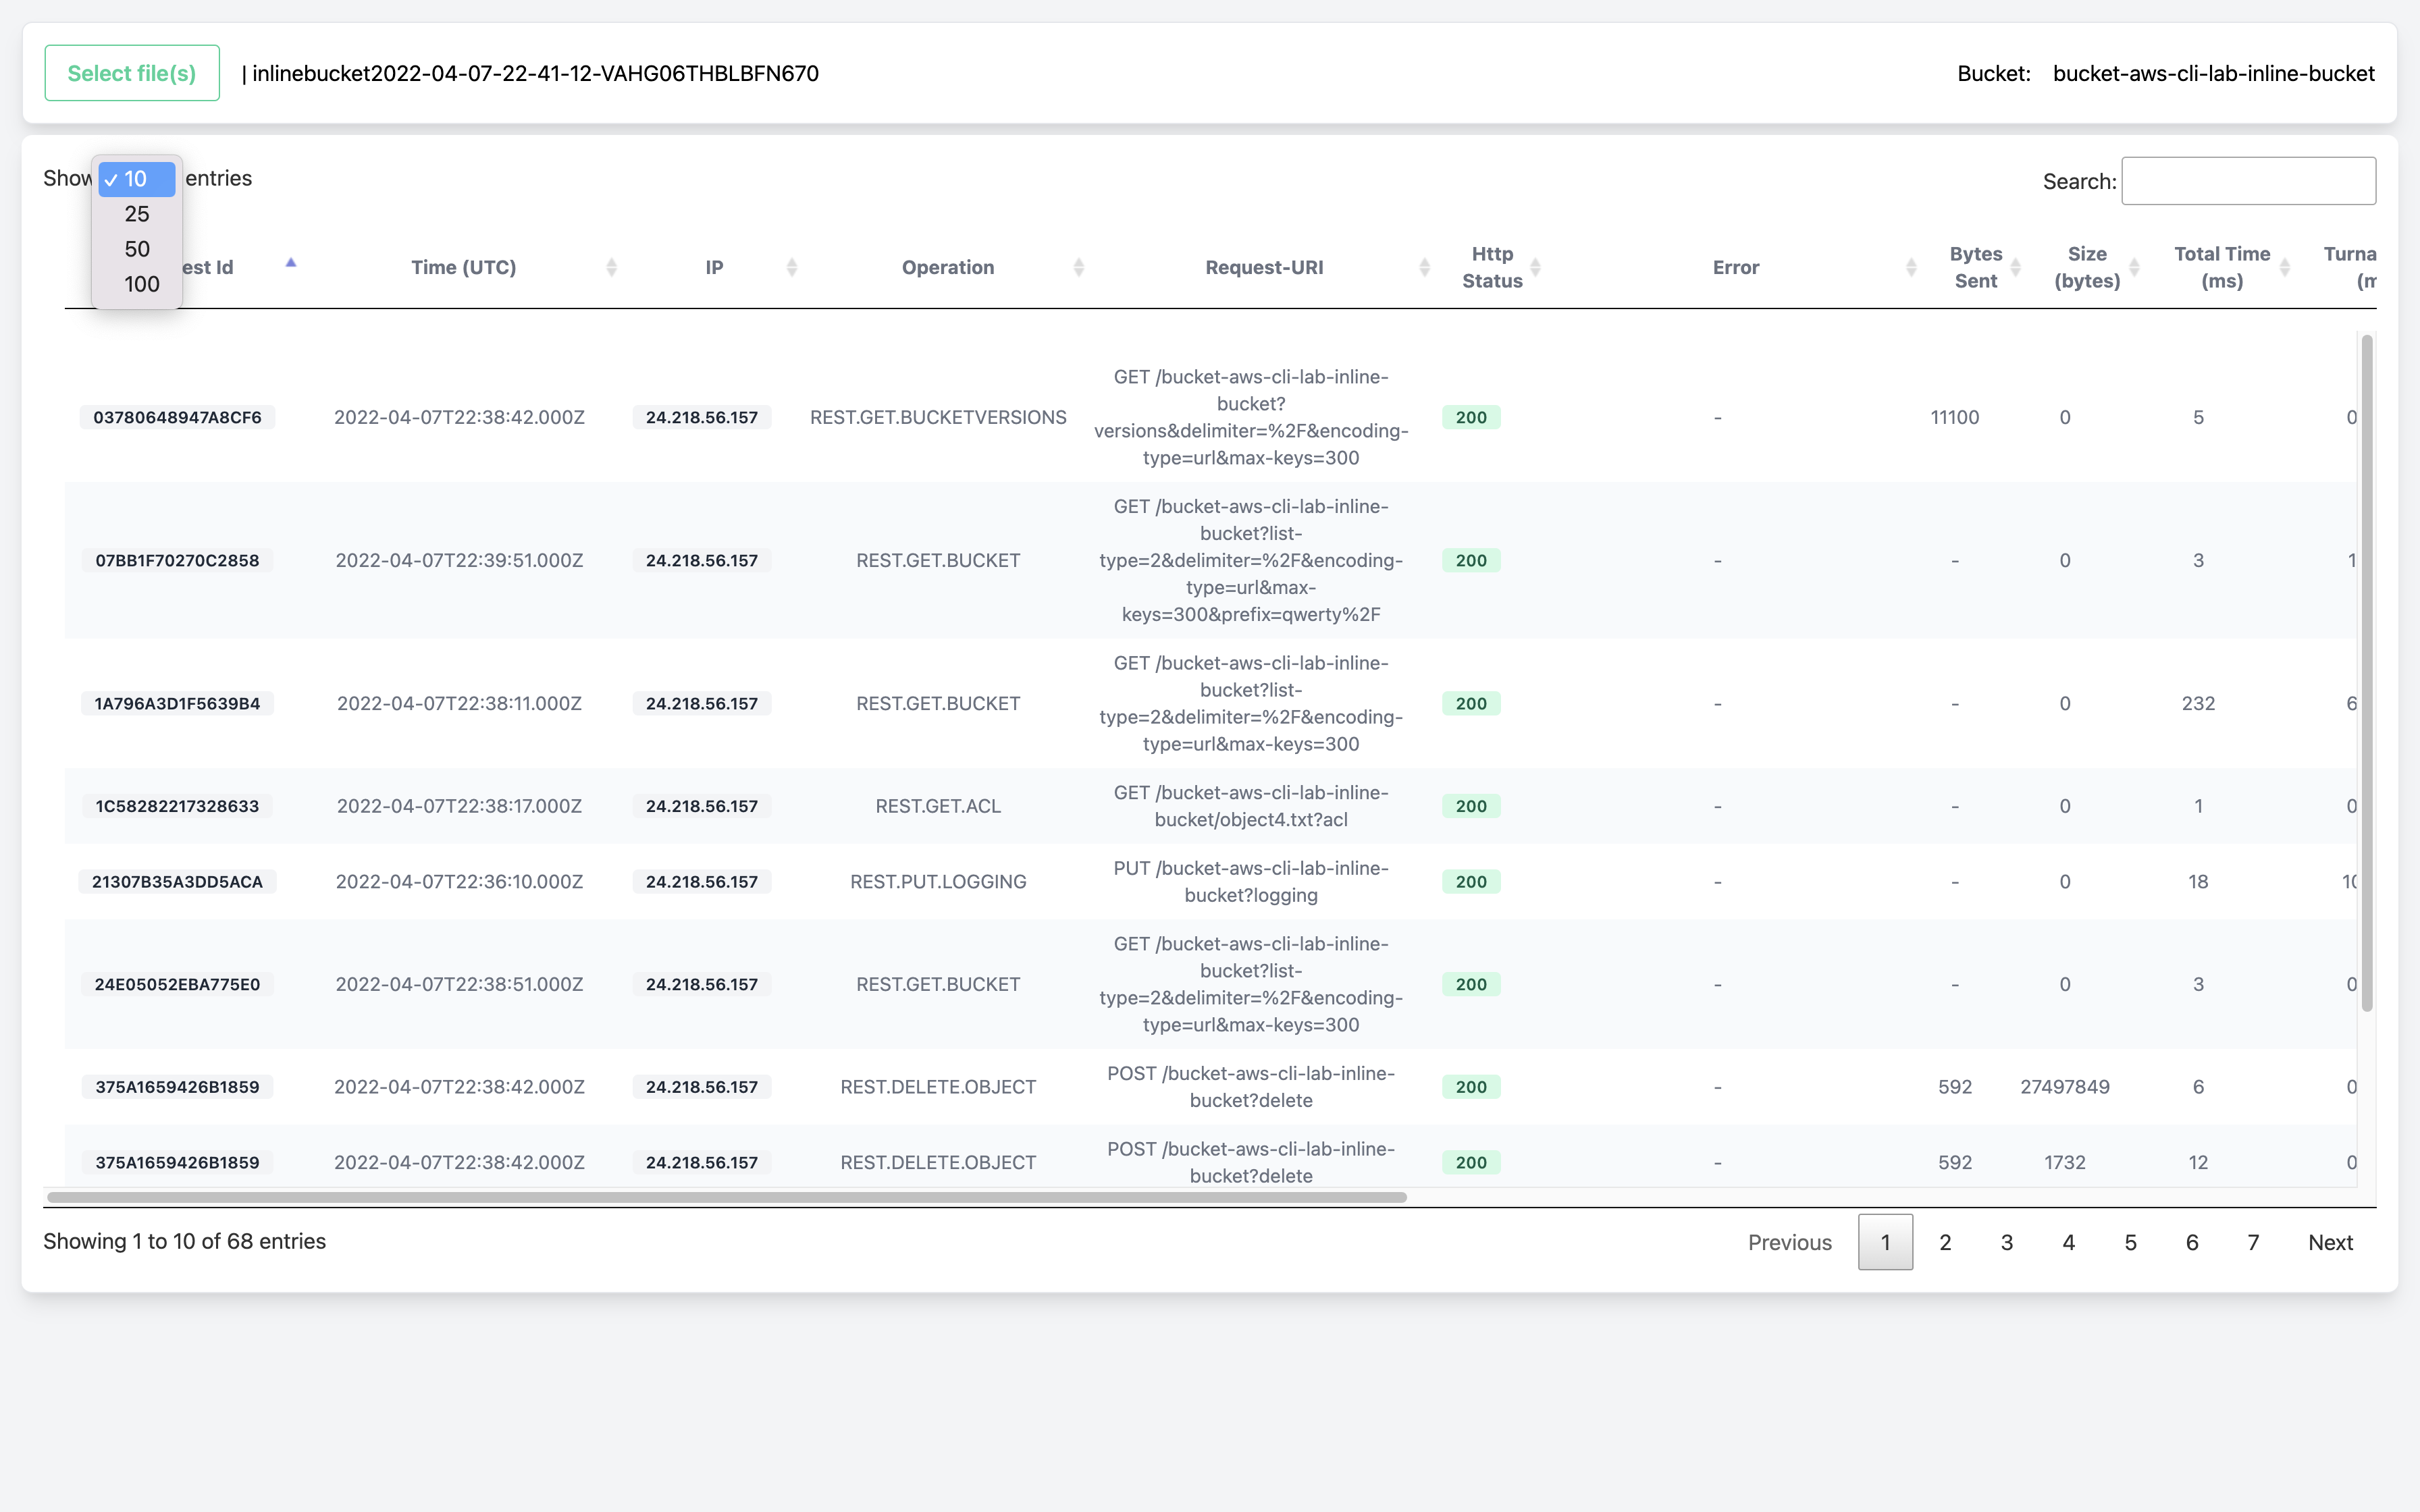
Use the search bar at the top to filter based on keywords for HTTP status codes, Request-URI, Request ID, Operation, and so on.