The Wasabi Surveillance Cloud - Source Dashboard (source monitoring dashboard) is an optional service that enables you to monitor critical services on your local server. The dashboard provides trigger email alerts when services on the server hosting the WSC client exceed predefined thresholds, which may adversely affect replication or synchronization processes.
Getting Ready
- Ports 5090 and 5091 must be open on the machine where the dashboard is installed
Installation Video
Installing the Dashboard
- Install the WSC Source Monitoring API on the machine installed with the WSC client, which acts as a source (Management Server). To do so, download the WSC Source Monitoring API and run the executable.
- Download the WSC source monitoring dashboard and run the executable.
- Download the WSC source monitoring serviceand run the executable. Do this on each recording server if you have multiple recording servers distinct from the management server. Complete the next steps on each recording server.If you have an all-in-one server (Management + Recording), you do not need to edit the JSON (Steps 4-6). The default configuration will work.
- Search for "appsettings.json" on your server.
- Edit with Notepad to replace localhost on the first line with the hostname or IP of the dashboard machine.
- Update “SendDataUrl”: https://localhost:5090/api/monitoringdata
Accessing the Dashboard
Open a web browser and access the following URL: http://localhost:5091
If the folders from different drives on the server are mapped to the buckets from your Wasabi storage account, the drives will appear separately in the left navigation menu under the server name.
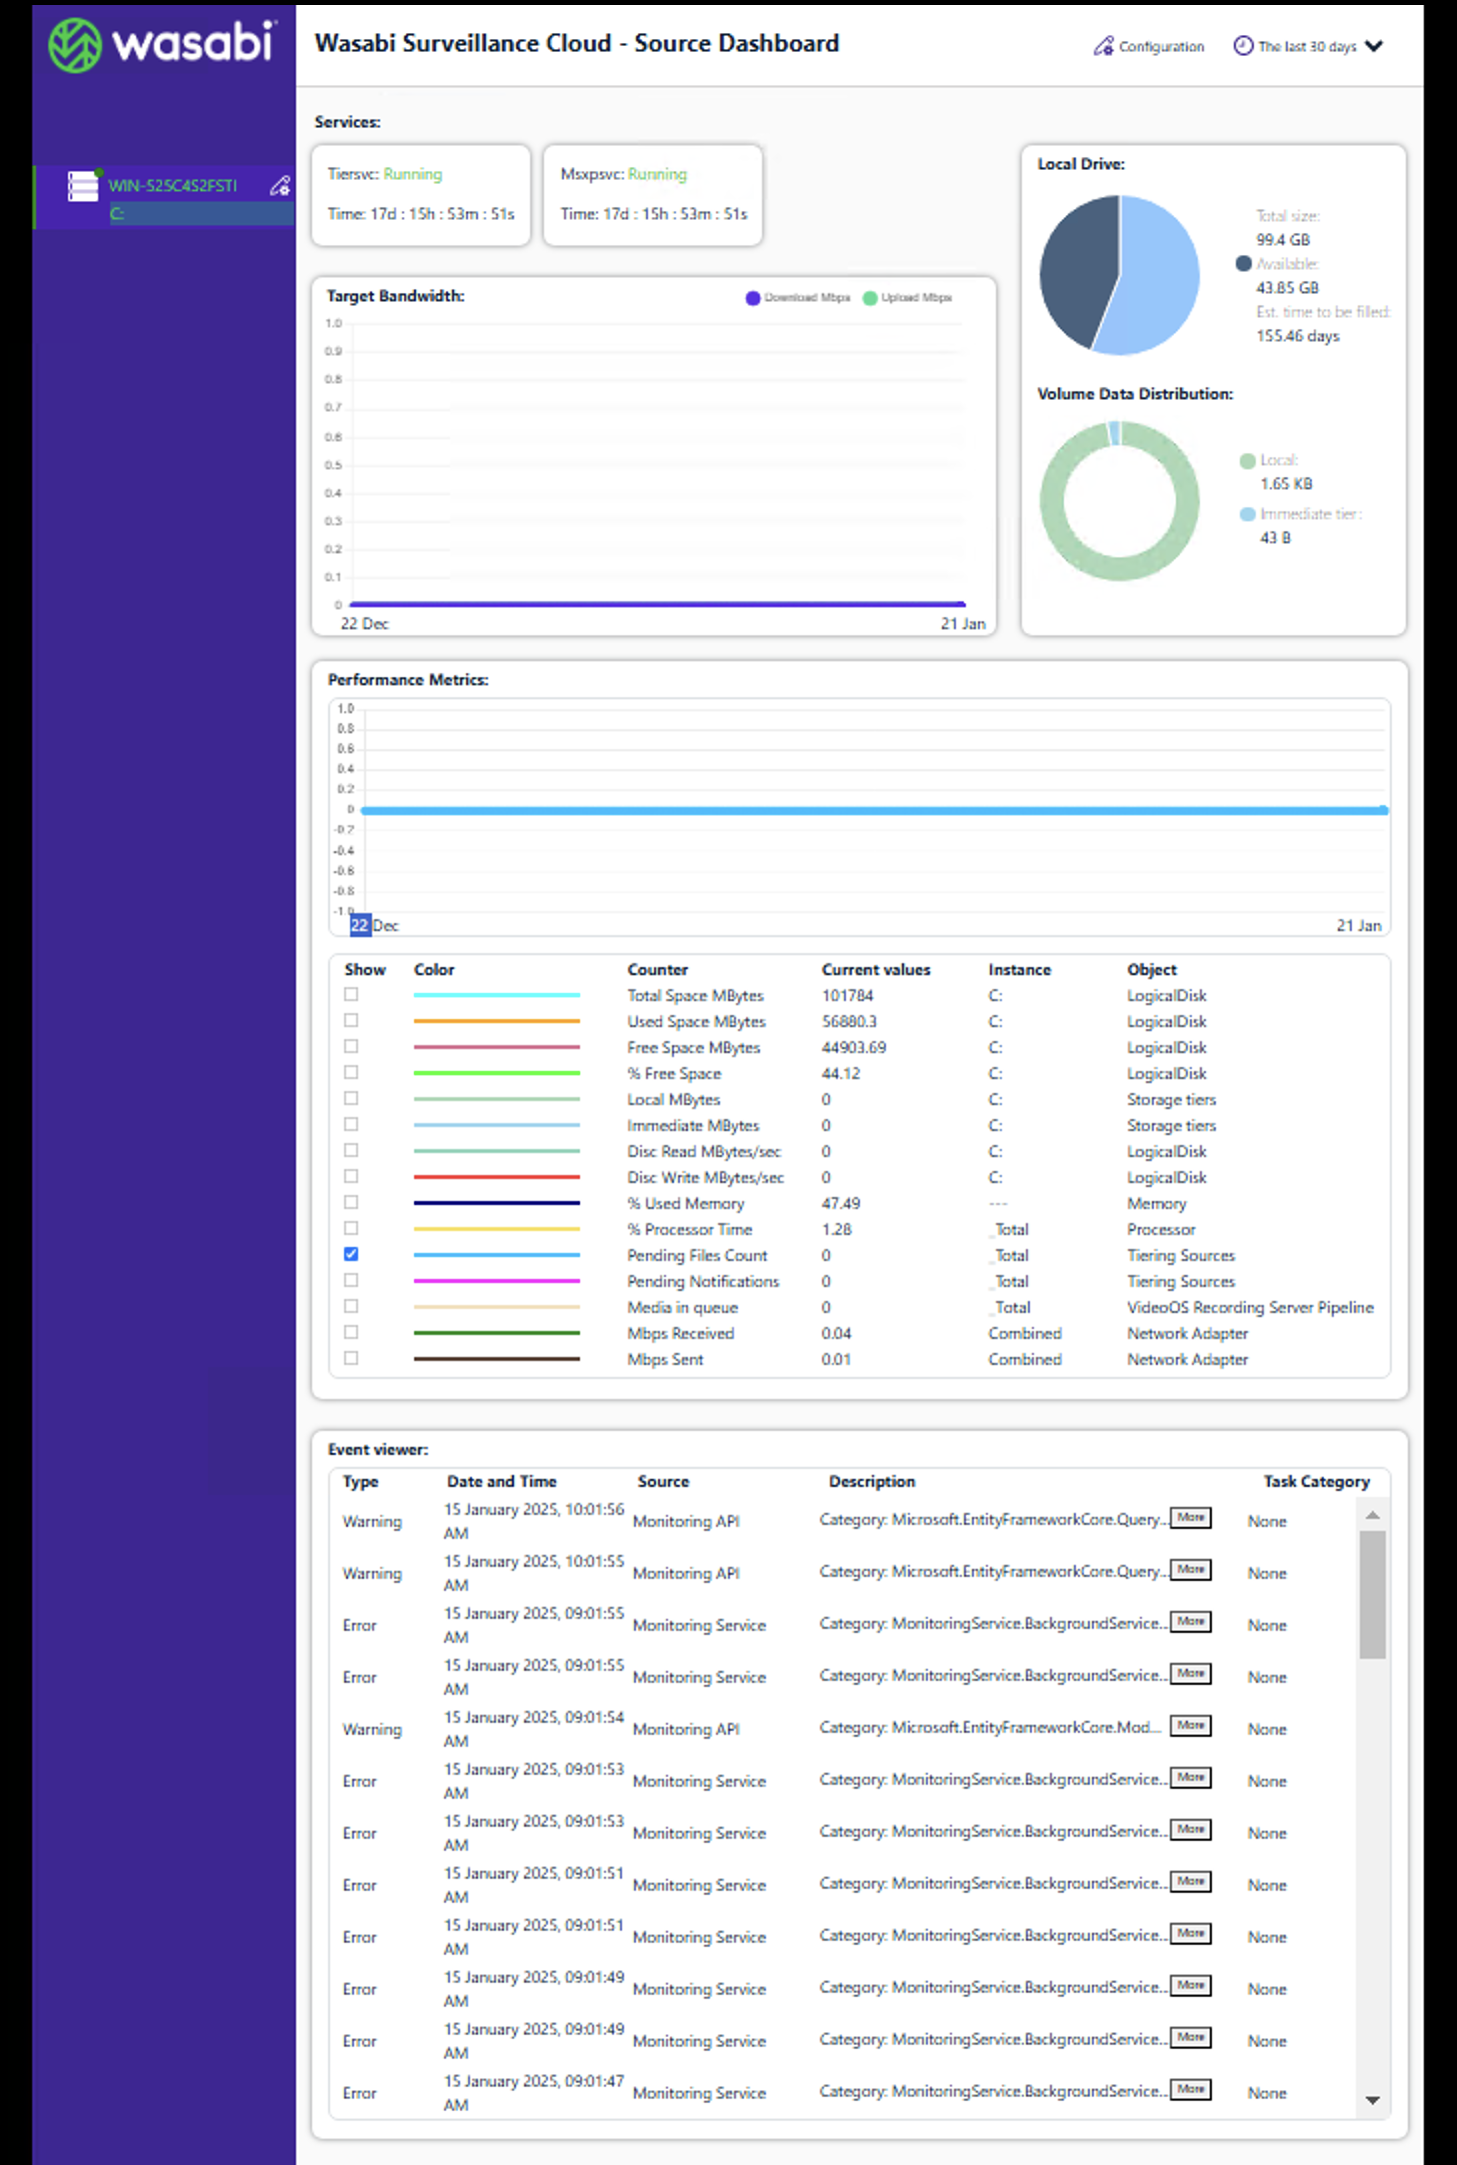
Dashboard Widget Details
Storage Utilization
The Local Drive chart provides a comprehensive overview of the status of the local drive. Be sure to note that the available free space reported includes any drive virtualization options that may have been configured within the Surveillance Bridge user interface. When establishing an alarm, consider using either the percentage or the volume relative to the total available space as reported by Windows, rather than solely focusing on the physical disk capacity.
Target Bandwidth
The Target Bandwidth shows the amount of data being pushed to (or pulled from) your cloud account in real time.
Performance Metrics
All performance metrics are maintained for 30 days. Users can view the data for the past 30 days or 2 days. The scale adapts for each metric. The following key performance indicators and services can be monitored using the dashboard:
- Tiersvc service: The main service associated with the Wasasbi Surveillance client software. It processes, queues, manages data replication, reclaims space, and archives and sync policies. If this service is down, WSC is entirely inoperable.
- Msxpsvc Service: This service collects information associated with the locations and states of files, which is then used by the WSC plugins. When this service is stopped, users cannot see the colored section in the Milestone XProtect timeline and the job managers cannot differentiate cameras and timings.
- Estimated time to be filled is a metric calculated by comparing the current data generation rate (disk write) against the outgoing traffic. The leftover free space in the local source is also considered for estimating this metric. If the estimation is under three days, you should receive an alert.
- The event viewer section displays the latest 1000 events logged by the WSC client application on the local machine.
- The dashboard refreshes automatically every minute.
Event Viewer
This widget pulls the latest logs recorded in the event viewer on the server where the dashboard and the WSC client are running. These logs are recorded by the WSC client software and refreshed periodically. Configuration settings provide an option to specify a keyword of interest and get notified if the event viewer log(s) contains that keyword.
Configuring Alerts
To set up an alert, click Configuration in the upper right. All connected servers must be enabled before configuring threshold criteria and specifying an email address where the notifications will be sent.
You can configure settings globally by clicking on the top right corner, or, configure each server individually.
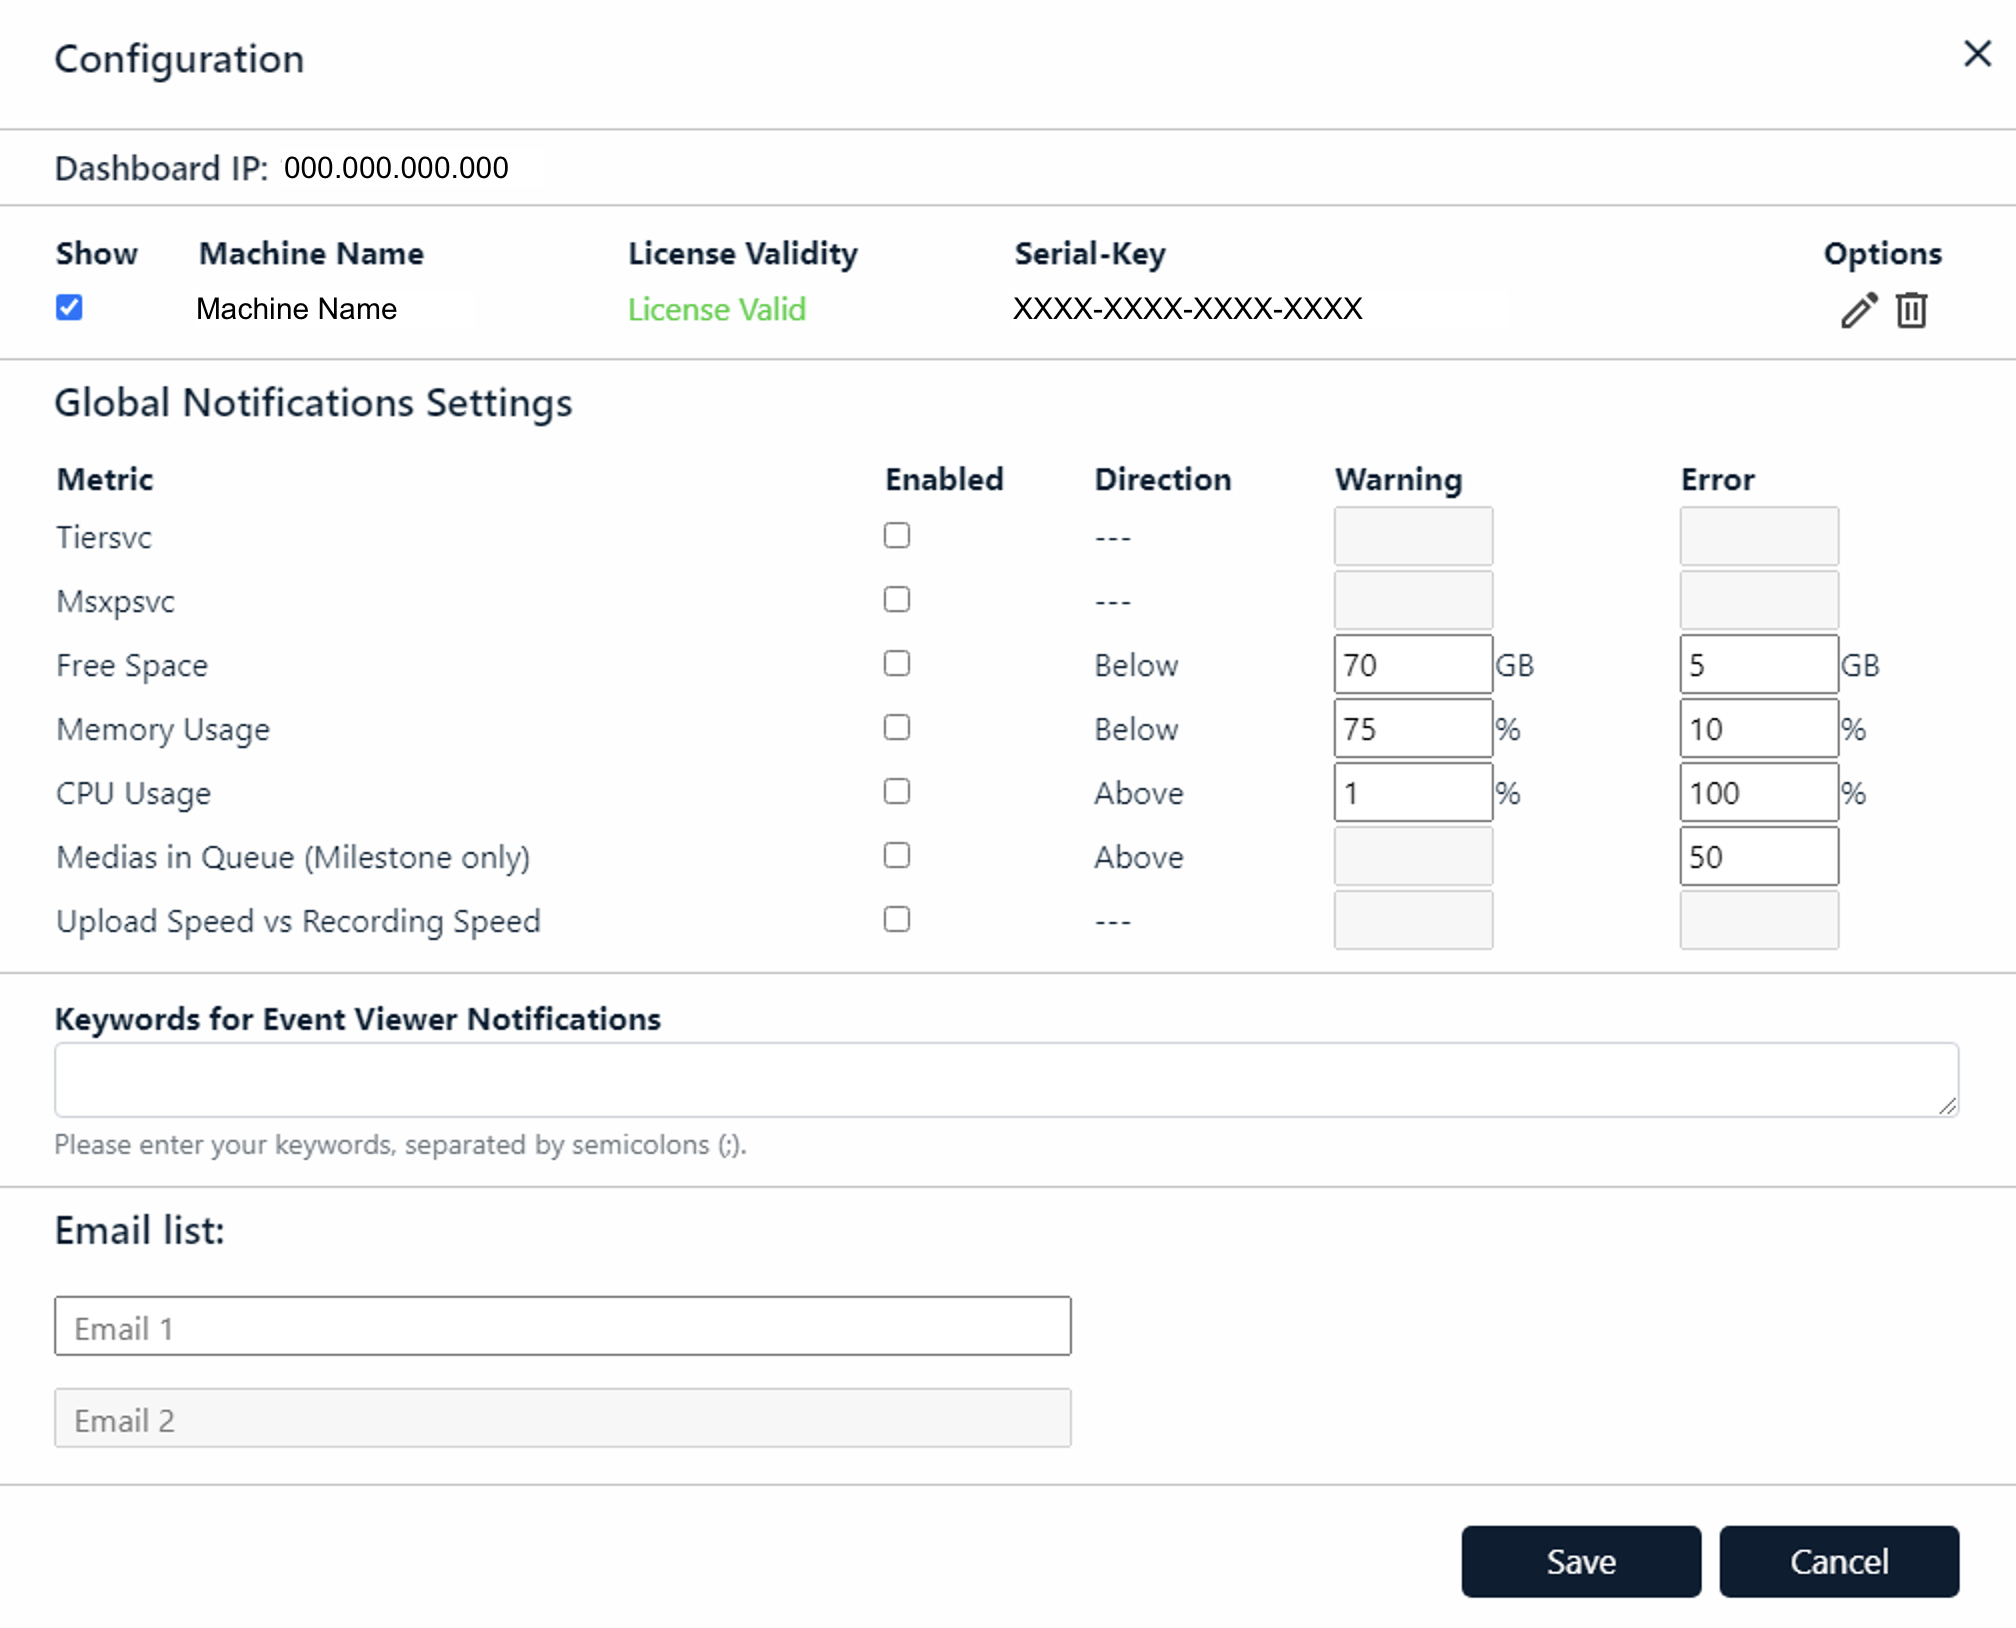
Email alerts can be set for Tiersvc, msxpsvc, Free Space, Memory Usage, CPU Usage, Media in Queue (Milestone), Upload vs. Recording Speed, and Keywords in event viewer logs.
An email is sent to the user when free space on their server is estimated to last less than three days. This setting cannot be configured via the dashboard.
You will receive an email from wsc-alert@wasabi.com for all the alerts you have configured using this dashboard. Add this email to your contacts list and whitelist the address to prevent emails from going to your junk folder. Do not reply to this email, as this mailbox is unmonitored.
For more detail, contact support@wasabi.com.