A bar graph shows account utilization (calculated over the last 30 days) with total objects represented in purple and deleted objects in red.
On the Buckets list, click
 for the desired bucket.
Click Settings.
Click the Utilization tab. A bar graph is displayed. For example:
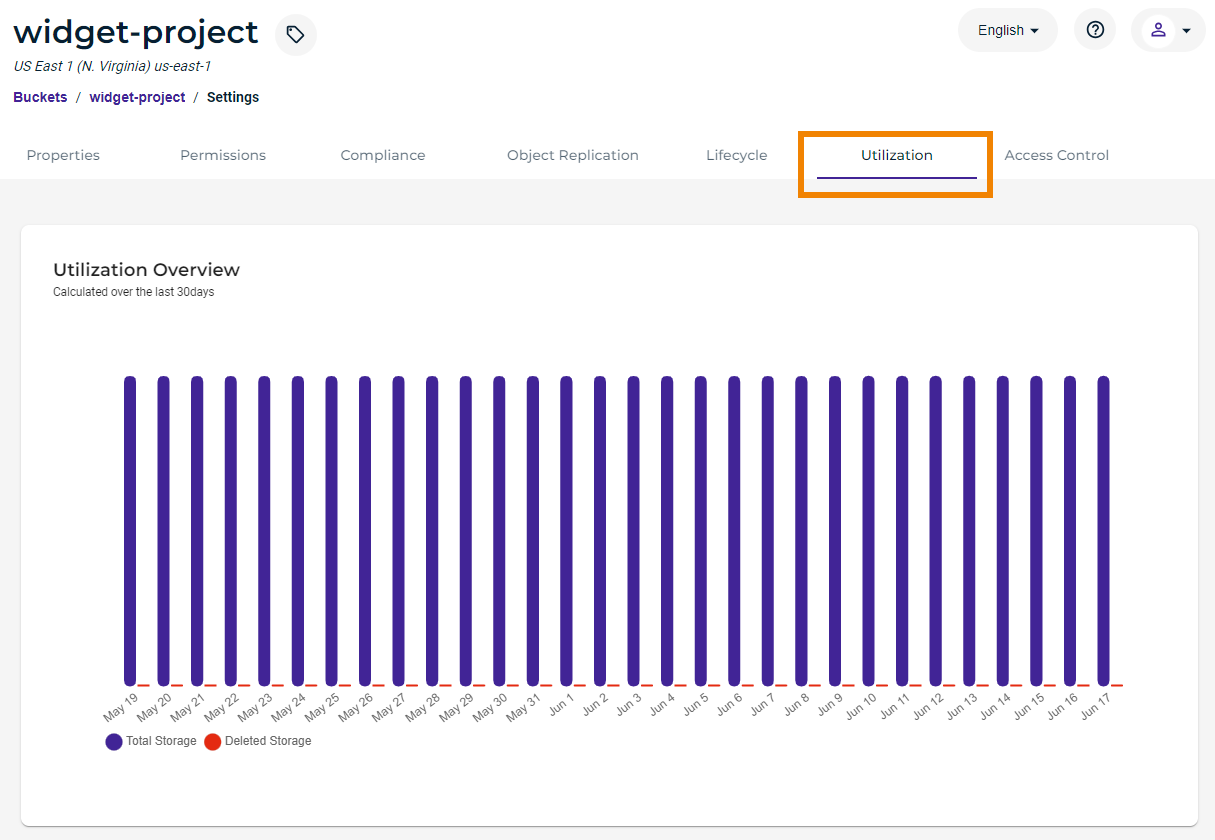
You can hover over the graph to see the total storage and deleted storage in bytes. Deleted storage refers to the amount of data deleted from the bucket before meeting the Minimum Storage Duration Policy.
.